Viv overview
Introduction
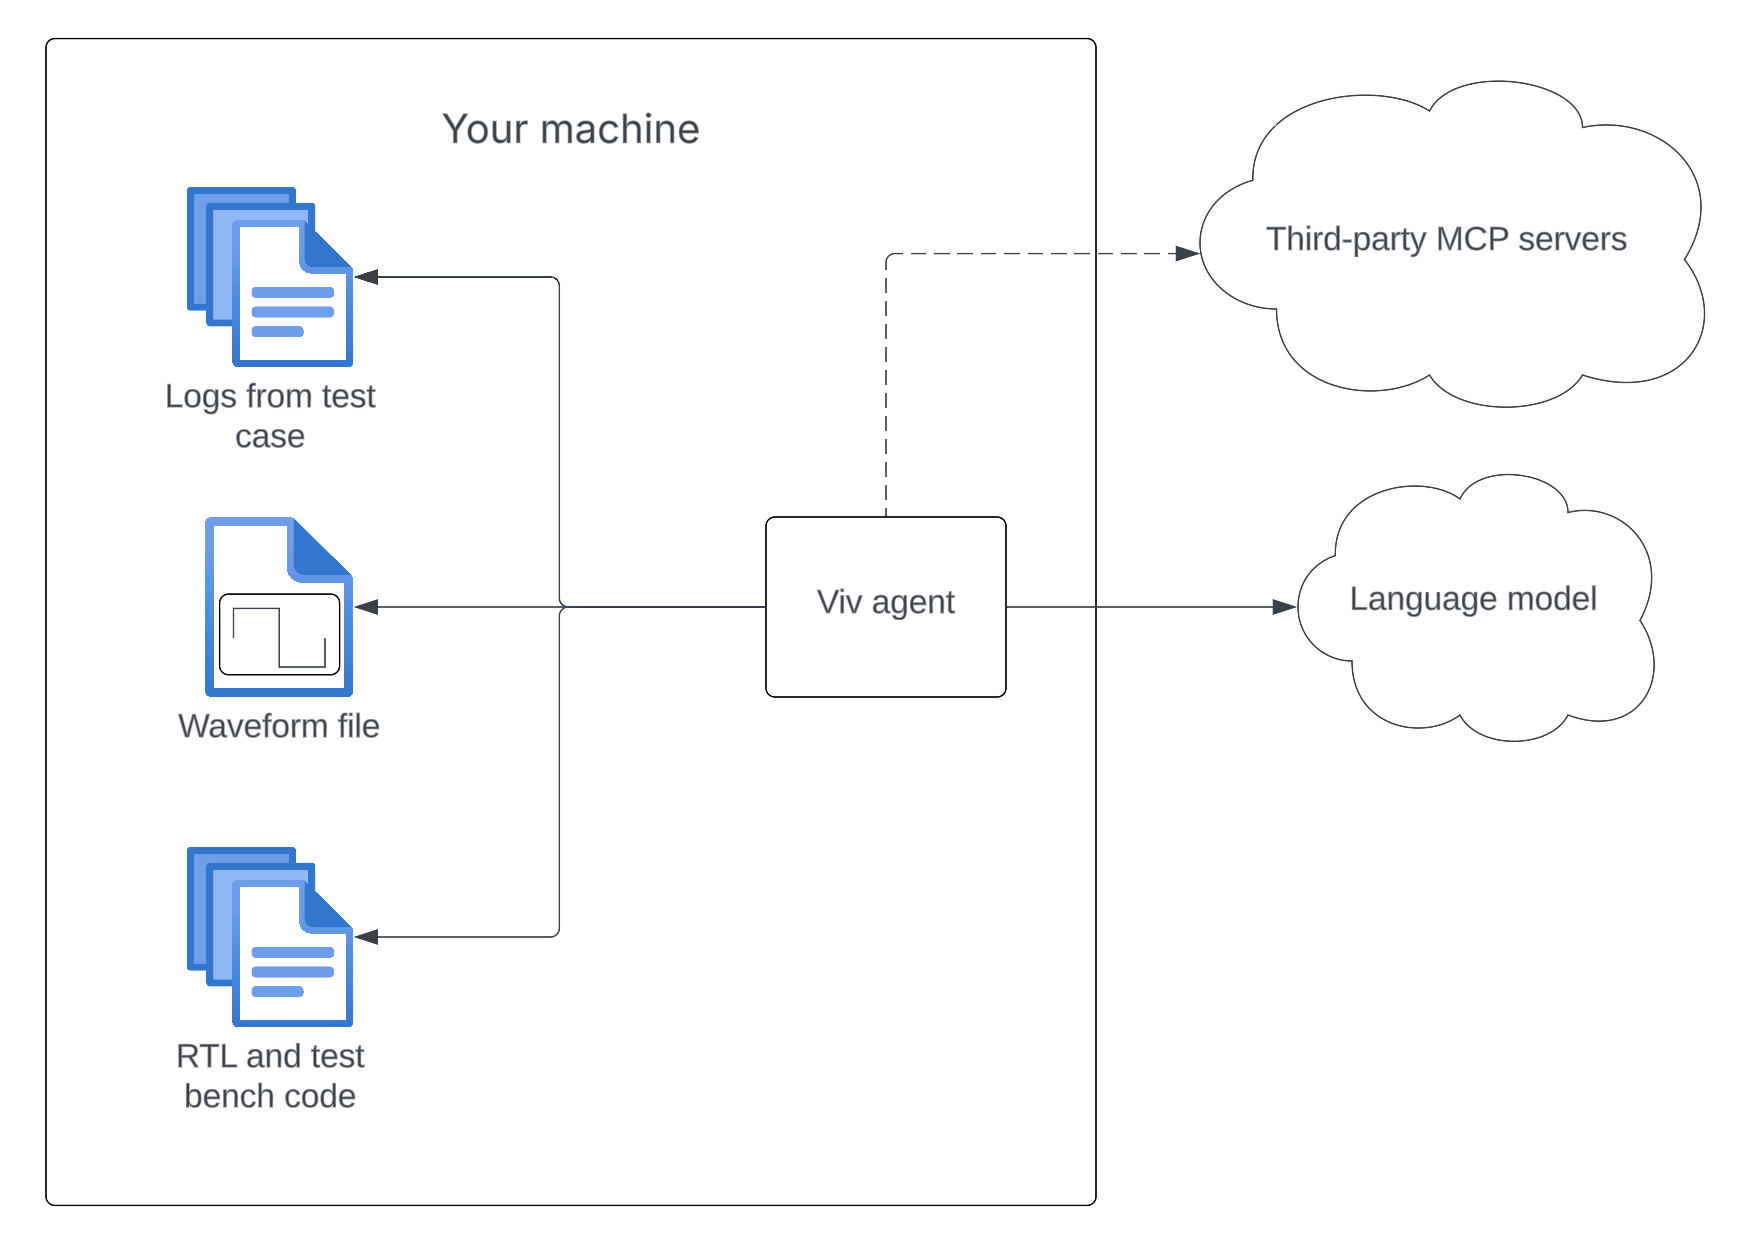
Viv is an AI agent for digital verification. Starting from a failing test case, Viv uses code, logs, waveform files, and specifications in order to find the root cause of the bug.
This diagram shows a simplified overview of how Viv works.
Why Viv
- Fast setup: Viv is a single Node.js package — install it in seconds with
curl -fsSL install.silogy.io | bashand start debugging immediately. - Simple interface: Run
viv submitfrom the command line with your code and logs. No complex configuration or infrastructure required. An optional VS Code extension is available for an integrated UI experience. - Minutes to root cause: Viv autonomously analyzes code, logs, waveforms, and specs to identify the root cause of a failing test case and produce a detailed bug report — typically in minutes.
- Efficient waveform analysis: Viv can analyze multi-gigabyte waveform files, querying signal behavior directly so you don't have to manually inspect waveforms.
- Secure and on-premise: Viv runs entirely within your infrastructure — no design data ever leaves your data centers.
- Works with your LLM provider: Bring your own API key for OpenAI, Claude, Llama, or any vLLM-compatible endpoint — or drive Viv through your existing Claude Code CLI installation.
Frequently asked questions
Does any data leave my data center? No. Viv runs entirely on-premise. Your code, logs, waveforms, and specifications stay within your infrastructure. The only external communication is with the LLM API provider you configure.
What waveform formats does Viv support? Viv supports FST, VCD, and FSDB waveform files.
What LLM providers can I use? Viv works with OpenAI, Claude (Anthropic), Llama, and any vLLM-compatible endpoint. You bring your own API key.
Can I use Viv in CI/CD pipelines? Yes. Viv automatically runs in headless mode when stdin is not a TTY, outputting a Markdown bug report to stdout.
Do I need the VS Code extension? No. Viv is fully functional as a command-line tool. The VS Code extension is optional and provides an integrated UI experience.
Get started with Viv
Prerequisites
The starting point for Viv is always a failing test case.
The user running Viv must be able to read the following:
-
Code sources: One or multiple directories containing the version of the code that was used in the test case (passed via
-c).As an alternative, you can pass Synopsys VCS-style filelists (
.ffiles) via-for-F. All filelists, including nested ones, and the files and directories they refer to must be readable by the user. Useviv debug-filelists -f <path>to verify that your filelists resolve correctly. -
The logs directory: All the logs, artifacts, etc for the failing test in a single directory.
Installation and setup
Detailed instructions for how to install and set up Viv are located in the setup docs.
Debug a failing test case
First, ensure that the proper version of the code is in place in your code directory (~/project in our example) and that you have a copy of the logs from your failing test case available.
Then run:
# Using code directories
viv submit \
  --code-directory <path to your code directory> \
  --code-directory <another directory containing code files> \
  --artifact-path <path to the logs directory> \
  --export-markdown <output path to which Markdown-formatted debug results will be saved>

# Using VCS-style filelists
viv submit \
  -f <path to filelist.f> \
  --artifact-path <path to the logs directory>
For a full list of flags and commands, see the CLI reference.
You can also debug a test case by running:
viv
Select Submit and follow the prompts to start debugging.
View results
Wait for Viv to finish debugging the test case. Once it's finished, you'll see the bug report, which explains the root cause of the failure. Press the left and right arrow keys to switch between the bug report and the sequence of steps that Viv took to debug the bug. Results are saved automatically — you can browse and resume past analyses using viv history.
Start chat
Once Viv has finished debugging the error, you can get more information about the fail via chat. Press Esc to leave the results viewer and start chatting. From the chat input, press Esc again any time to reopen the results viewer; press Ctrl-C to exit. Ask a question to the chat and get an answer:
╭──────────────────────────────────────────────────────────────────────────────────────────────╮
│ > Can you create a Git patch that fixes the bug?                                             │
╰──────────────────────────────────────────────────────────────────────────────────────────────╯

Sure! Here's a Git patch that fixes the issue:


diff --git a/rtl/ibex_controller.sv b/rtl/ibex_controller.sv
index 72fff08e..5bde0507 100644
--- a/rtl/ibex_controller.sv
+++ b/rtl/ibex_controller.sv
@@ -587,7 +587,7 @@ module ibex_controller #(
           // stage ready_wb_i == 1 so the FSM will always go directly to FLUSH.

           if (ready_wb_i | wb_exception_o) begin
-            ctrl_fsm_ns = FLUSH;
+            ctrl_fsm_ns = SLEEP;
           end
         end
Run a parallel investigation
If you want Viv to explore multiple angles simultaneously, use viv swarm:
viv swarm \
  --artifact-path <path to the logs directory> \
  --code-directory <path to your code directory>
Viv will automatically generate 3–5 hypotheses about the failure (covering RTL bugs, testbench bugs, and spec ambiguity) and spawn one investigator agent per hypothesis. Each investigator runs independently, and a synthesizer then reads all their reports to produce a unified bug description. This is useful for complex failures where the root cause isn't obvious.
You can also provide a hint to steer one of the hypotheses:
viv swarm \
  --artifact-path ./logs \
  --code-directory ./rtl \
  --guidance "I suspect the FIFO pointer logic"
After the swarm finishes, you enter the same chat interface as viv submit, with access to all investigator findings.
Apply a fix
After Viv identifies the root cause, you can ask it to apply the suggested fix directly to your source files. Type /fix in the chat box:
╭──────────────────────────────────────────────────────────────────────────────────────────────╮
│ > /fix                                                                                       │
╰──────────────────────────────────────────────────────────────────────────────────────────────╯
Viv runs a focused agent pass that reads the analysis fix steps, edits your source files in place, and shows inline diffs of what changed. Modified files are listed after the fix completes.
If you'd rather review the changes before touching your source files, use /fix-patch instead. This generates a .patch file in ~/.viv/fix-logs/ without modifying any source files:
╭──────────────────────────────────────────────────────────────────────────────────────────────╮
│ > /fix-patch                                                                                 │
╰──────────────────────────────────────────────────────────────────────────────────────────────╯
The two commands share a cache: whichever runs first does the LLM work, and the other reuses the result. So you can run /fix-patch to inspect the patch, then /fix to apply it — or vice versa — without paying for a second LLM call.
Triage a whole regression
When many tests fail at once, use viv triage to find out how many distinct bugs are actually behind them:
viv triage \
  --artifact-path <directory of failing test-case folders> \
  --code-directory <path to your code directory>
Viv scans the directory for test-case folders, groups the failures by root cause, and writes a triage-report.json (plus a printed summary) showing each distinct bug ranked by impact and tagged as an RTL or testbench issue. It runs headless, with no chat phase.
Re-run analysis
After Viv finishes debugging, you can ask it to run a fresh analysis on the same artifact — for example, to investigate a different hypothesis. Type /analyze in the chat box, optionally followed by a hypothesis:
╭──────────────────────────────────────────────────────────────────────────────────────────────╮
│ > /analyze the issue might be in the write-back stage                                        │
╰──────────────────────────────────────────────────────────────────────────────────────────────╯
Viv will show a confirmation prompt listing the paths it will analyze. After you confirm, a fresh analysis runs and the conversation continues with the new findings. Summaries of all previous analyses in the session are passed to the new run so Viv avoids re-investigating the same ground.
Export to Markdown
To export Viv's debug output to Markdown for later inspection, run the slash command /export in the chat box:
╭──────────────────────────────────────────────────────────────────────────────────────────────╮
│ > /export /path/to/exported/bug.md                                                           │
╰──────────────────────────────────────────────────────────────────────────────────────────────╯
This will export a formatted bug report to the desired path.
VIV.md setup (optional)
If a file called VIV.md is present in the root of the working directory, Viv will use it as a guide to the repo and commonly found log files. This helps Viv guide its investigation and avoid wasting time figuring out how the codebase is structured. Viv also checks for a user-level VIV.md at ~/.viv/VIV.md, which is included in every session — use it for personal preferences that apply across all projects. A very simple VIV.md might look like:
# VIV.md

This repo contains RTL and testbench for a flux capacitor control module.

## Code architecture overview

### Core components

** RTL (`path/to/rtl/`)**
- RTL code written in Verilog
- etc.

** Testbench (`path/to/tb`) **
- Testbenches written in cocotb
- etc.

## Commonly found log files

- **sim.log** is the stdout/stderr from the simulation.
- **core_trace.csv** is a trace of the instructions handled by the golden model.
- etc.
You can create a VIV.md by yourself if you like, but we recommend creating one automatically and refining it afterwards. To create a VIV.md, run viv and select 2. Generate VIV.md. This will create a markdown file describing the structure of your repo, which you can edit manually after it is created. The more detailed this file is, the more efficiently Viv will be able to debug failing test cases. For a complete guide to writing an effective VIV.md, see Writing a VIV.md.
MCP server setup (optional)
Viv supports adding third party data sources in the form of Model Context Protocol (MCP) servers. Both the current Streamable HTTP transport and the legacy Server-Sent Events (SSE) transport are supported; stdio is not yet supported. To connect a server, simply run viv mcp add <MCP server URL> — Viv probes the server and selects the right transport automatically. Examples: https://mcp.notion.com/mcp (Streamable HTTP), https://mcp.atlassian.com/v1/sse (legacy SSE). You will need to consult each third party's documentation to find its MCP URL.
If the server requires OAuth, Viv will open a browser tab to ask for permission to access the resources. Tokens are persisted to ~/.viv/mcp-tokens.json and refreshed automatically in the background, so long-running chat sessions outlive the original token TTL without re-authentication.
You can list MCP servers (with their detected transport) using viv mcp list and remove a server using viv mcp remove <server ID>.
This functionality is also accessible by running viv, selecting "Manage MCP servers", and adding / inspecting / removing servers.
Configured MCP servers are available to both the default agent and the Claude Code agent (provider: "claudecode"); the same set of tools is exposed regardless of which provider drives the analysis.
Knowledge store
Viv automatically remembers what it learns across debug sessions — spec locations, block-to-spec mappings, and codebase observations. On subsequent runs against the same project, the agent starts with this context instead of a blank slate.
The knowledge store is enabled by default. On the first run, Viv will auto-detect the project from the git remote and scan for specification files. Use viv knowledge list to see what Viv knows, or viv knowledge status for store health. When an ingest looks stuck or you need to know whether to resume vs. force-rescan, viv knowledge status <spec> (passing a file path or hash prefix) shows the per-spec lifecycle: producer, status, pages completed, lock entries, last ingest cost. See the knowledge store section of the configuration reference for details.
Vision-LLM PDF ingest
When the configured digest provider supports vision (Anthropic Claude 3.5 Sonnet+ / 4.x, OpenAI gpt-4o+ / gpt-5.x with vision, Claude Code on a vision-capable model), viv knowledge add-spec <some-spec.pdf> automatically routes the PDF through a multimodal vision-LLM ingest. Each page is rendered to a 200-DPI PNG via pdftoppm and attached as image input to the model, which emits per-section markdown directly. A text-only provider (Llama, vLLM by default) falls back to the regex-based heuristic ingest unchanged.
The vision path closes three failure modes the heuristic struggles with on chip specs: multi-page tables that get clipped at the next heading, table-of-contents pages whose dotted-leader entries surface as ghost sections, and figure-anchored sections whose body is essentially "see the diagram." The on-disk shape under ~/.viv/projects/<project>/extended/spec-sections/<spec-hash>/ is byte-for-byte compatible across producers — every consumer (BM25 search, INDEX.md lookups, citation rendering) works the same on agentic and heuristic output.
Markdown / plain-text specs always go through the heuristic path; the vision step is only useful on PDFs. Re-running add-spec on a spec that's already complete short-circuits the ingest as before; --force-rescan re-extracts under whichever path the current configuration selects.
Uninstall
To uninstall Viv, just run npm uninstall -g @silogy/viv.